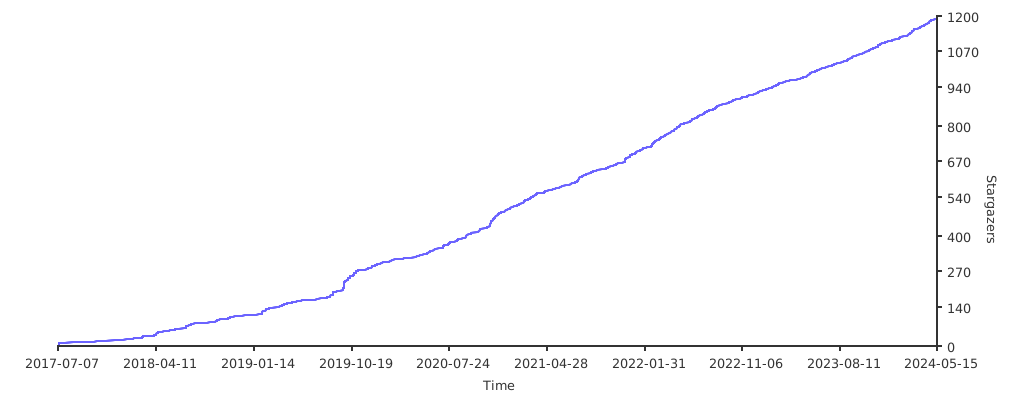
Plot your repository stars over time.
1.4k
Stars
143
Forks
2
Open issues
14
Contributors


AI Analysis
Starcharts is a Go application that generates visual charts tracking GitHub repository star growth over time, accessible via a web interface. It is specifically designed for repository maintainers and analysts who want to visualize and monitor their project's popularity trajectory. The project includes smart sampling optimization for repositories with large star counts, making it most valuable for developers and data enthusiasts interested in GitHub metrics visualization rather than general-p...
Inferred from signals mentioned in the README (tests, CI, type safety) — not a review of the actual code.
AI's overall editorial judgment — not an average of the bars above, can weigh other factors too.
Go service for visualizing repository star growth over time with smart sampling for large projects
starcharts is a web service that generates trend charts showing how a GitHub repository's star count has grown over time. Built in Go, it targets developers and project maintainers who want to visualize engagement metrics. The project uses intelligent sampling to handle repositories with thousands of stars efficiently. Adoption appears concentrated among individual developers and smaller teams rather than widespread enterprise use.
Created in July 2017 by caarlos0, the project emerged during a period of growing interest in GitHub analytics and project metrics visualization. It has evolved to address performance challenges with large repositories through smart sampling mode, suggesting responses to real usage scaling issues.
The project gained approximately 1,423 stars over nine years with steady but modest growth. No stars were gained in the last 7 days (as of 2026-07-03), and the lack of recent spike activity suggests growth has plateaued into a maintenance phase. The last push occurred on 2026-07-01, indicating active but infrequent maintenance rather than active development.
README includes a self-referential example (starcharts' own star chart at starchart.cc), suggesting the tool is used in production. However, concrete evidence of third-party adoption, deployment counts, or user testimonials is not present in the available documentation. Adoption not verified beyond the single self-hosted example.
Based on README, the service appears to follow a client-server model with a Go backend exposing HTTP endpoints at /me/{owner}/{repo}. It implements Redis caching for performance and uses GitHub API pagination with intelligent sampling. The smart sampling algorithm auto-detects repository size via Link headers and switches strategies accordingly. Appears to be a stateless web service designed for horizontal scaling.
README includes a CodeCov badge and references GitHub Actions CI/CD workflow for build status, suggesting testing infrastructure exists. However, specific coverage percentages and test methodology are not documented in the provided README excerpt.
Last push 2026-07-01 (2 days before evaluation date) indicates active maintenance. Build status badge and CI workflow referenced suggest automated testing is in place. However, zero stars in last 7 days and the 9-year age without explosive growth suggests this is a mature, stable project in maintenance mode rather than active feature development. Activity pattern appears consistent with a complete, fit-for-purpose tool that doesn't require frequent updates.
ADOPT IF: you need a lightweight, self-hosted service to visualize star growth trends, want to embed star charts on documentation sites, or operate a repository analytics workflow where GitHub's native insights don't meet display requirements. AVOID IF: you require extensive third-party adoption validation, expect frequent feature additions, or need guaranteed high-availability SLA support from maintainers. MONITOR IF: you're considering this for mission-critical metrics and want to verify production stability through your own testing, or if you need enterprise support — the current evidence suggests individual-contributor maintenance rather than backed infrastructure.
Independent dimensions
Mainstream potential
3/10
Technical importance
4/10
Adoption evidence
2/10
- Single maintainer (caarlos0 primary contributor) creates bus-factor risk for production deployments; unclear if there are other active maintainers
- Adoption not verified beyond self-referential example; limited public evidence of production users or deployment scale, making it difficult to assess real-world reliability patterns
- GitHub API rate limits and pagination changes could impact the sampling algorithm; no explicit dependency versioning or API stability guarantees documented
- Redis dependency introduces operational complexity; misconfiguration or cache failures could degrade service without fallback behavior documented
- Smart sampling mode may introduce sampling artifacts or gaps in trend visualization for edge cases; no documented validation or accuracy testing methodology in README
starcharts will likely remain a stable, niche tool for individual developers and small teams wanting to visualize repository trends. Expect continued maintenance at low cadence (infrequent updates to handle GitHub API changes), but unlikely to see major feature expansion or mainstream adoption without significant marketing or integration partnerships. May see modest adoption in developer documentation workflows where embedded charts add aesthetic value.
Newsletter
Get analyses like this every Monday
Free weekly digest of the most interesting open-source discoveries.
Languages
Information
- Website
- https://starchart.cc
- Language
- Go
- Last updated
- 1w ago
- Created
- 110mo ago
- Analyzed with
- anthropic/claude-haiku-4-5
Stars over time
Contributors over time
Top 100 contributors only — repos with more will plateau at 100.
Open issues
Open pull requests
Top contributors
Similar repos

star-history/star-history
Star History provides a web-based tool and Chrome extension to visualize GitHub...

jstrieb/github-stats
Generates GitHub profile statistics visualizations using GitHub Actions,...

go-echarts/go-echarts
go-echarts is a Go library for creating interactive charts and visualizations...
| Repository | Stars | Week Δ | Language | Score | Updated |
|---|---|---|---|---|---|
|
caarlos0/starcharts
this
|
1.4k | — | Go | 7/10 | 1w ago |
|
star-history/star-history
|
9.3k | — | TypeScript | 8/10 | 2d ago |
|
jstrieb/github-stats
|
3.5k | — | Zig | 8/10 | 3w ago |
 maguowei/starred maguowei/starred
|
1.9k | — | Python | 7/10 | 3w ago |
|
go-echarts/go-echarts
|
7.6k | — | Go | 7/10 | 3w ago |
 AmintaCCCP/GithubStarsManager AmintaCCCP/GithubStarsManager
|
3.2k | — | TypeScript | 7/10 | 2d ago |
GitHub's built-in insights provide star history natively; starcharts differentiates by offering a standalone, self-hosted chart visualization that can be embedded or shared independently
Other star history tools exist; starcharts' Go implementation and smart sampling approach may offer performance advantages, though direct feature parity is not documented in README
Organizations building proprietary metrics dashboards may view starcharts as a lightweight, focused alternative to building in-house solutions
General-purpose GitHub API wrappers serve different use cases; starcharts is a purpose-built service rather than a library
Enterprise teams may prefer plugging GitHub data into existing monitoring infrastructure; starcharts is a standalone, simpler alternative for basic trend visualization