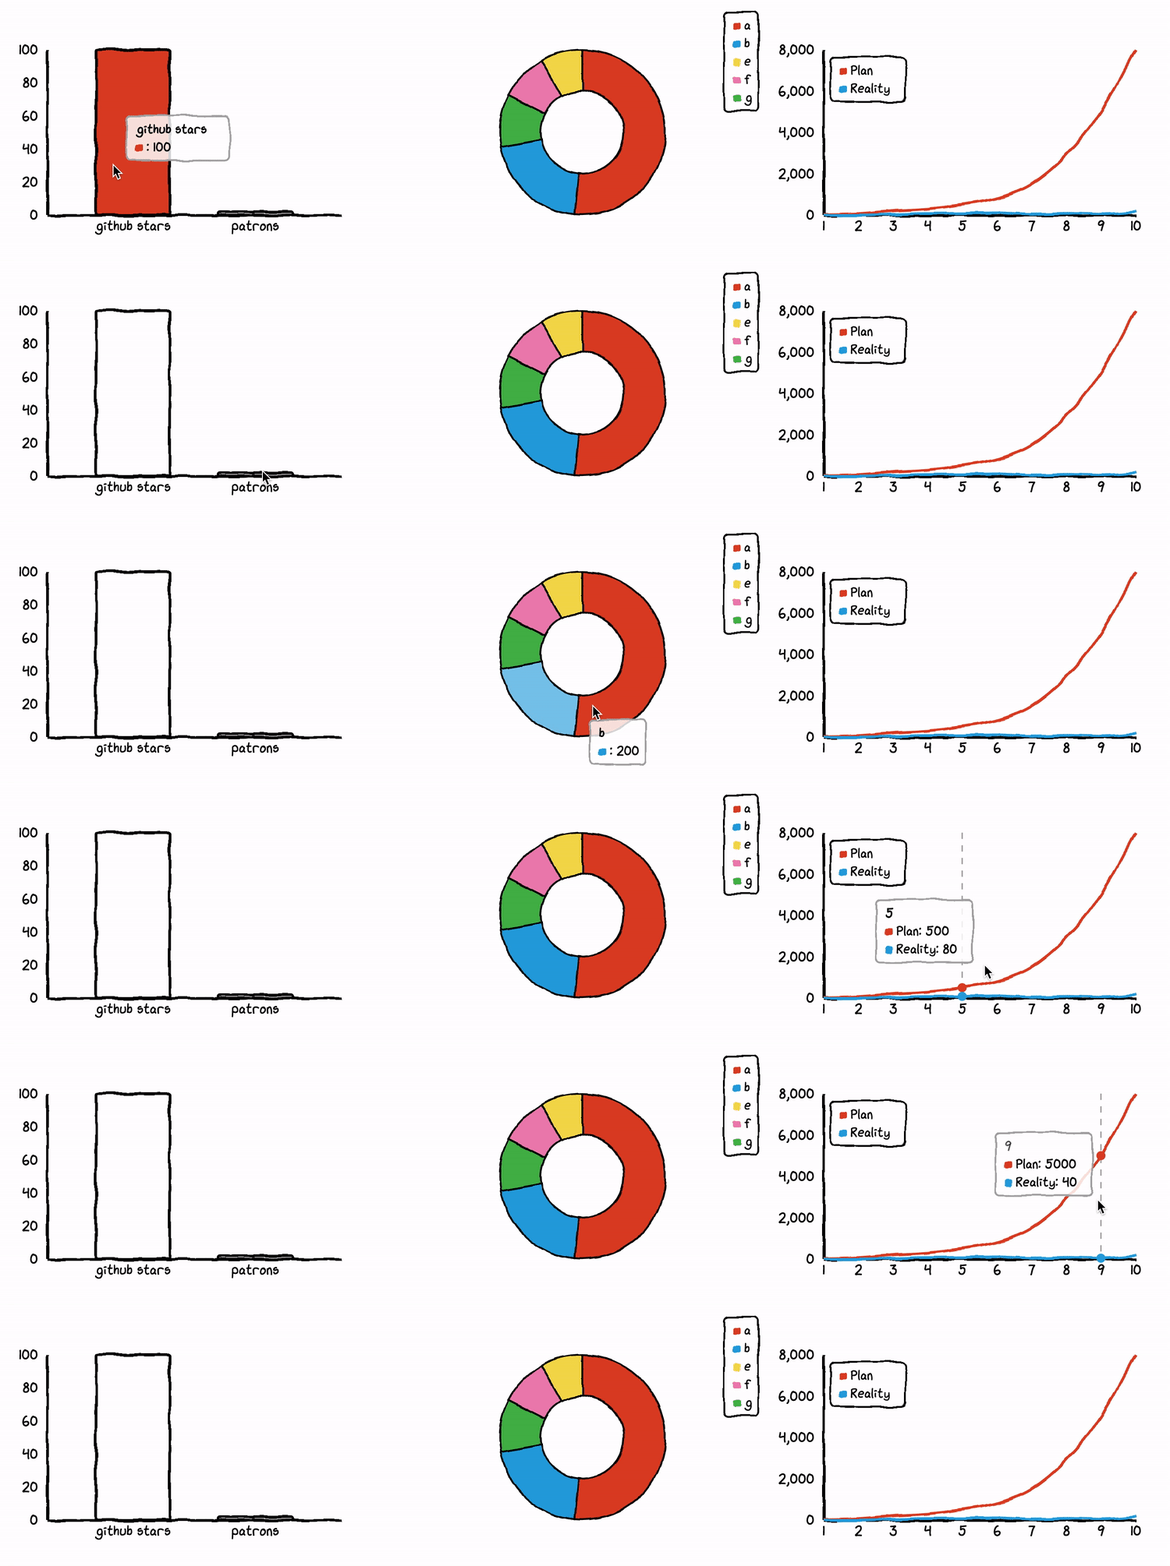
xkcd styled chart lib
7.8k
Stars
208
Forks
0
Open issues
16
Contributors


AI Analysis
Chart.xkcd is a charting library that renders visually distinct "sketchy" or hand-drawn styled charts using SVG, designed specifically for developers who want to create informal, cartoon-like data visualizations. It serves web developers and technical communicators who prioritize aesthetic presentation of data over traditional corporate chart styles, and is not intended for users requiring highly precise, formal business intelligence or real-time analytical dashboards.
Inferred from signals mentioned in the README (tests, CI, type safety) — not a review of the actual code.
AI's overall editorial judgment — not an average of the bars above, can weigh other factors too.
chart.xkcd renders hand-drawn styled charts in JavaScript, targeting creative and casual presentation use cases
chart.xkcd is a JavaScript charting library that renders line, bar, pie, and other chart types in a deliberately sketchy, hand-drawn aesthetic inspired by the xkcd webcomic. It is built for developers, bloggers, and communicators who want charts that feel informal, approachable, or humorous rather than corporate. The API closely mirrors Chart.js conventions, lowering the learning curve. With ~7,800 stars and recent pushes as of June 2026, it occupies a well-defined stylistic niche rather than competing directly with general-purpose charting libraries.
Created in August 2019 by indie developer timqian, likely inspired by the xkcd comic aesthetic trend that also influenced matplotlib's xkcd mode. It gained rapid initial traction via social sharing of its distinctive visual style.
The project saw a sharp early spike driven by novelty and social media virality around its launch in 2019. Growth has since plateaued — gaining only ~5 stars per week as of mid-2026 — which is consistent with a mature, stable niche tool rather than an actively growing product. The aesthetic appeal rather than functional necessity defines its ceiling.
NPM distribution via jsDelivr CDN suggests real usage exists, but scale is unverified. CodePen examples are publicly available. No case studies, enterprise users, or download statistics are cited in the README. Adoption appears to be concentrated in personal blogs, creative projects, and educational contexts rather than production applications.
Appears to be a single-bundle JavaScript library distributed via CDN (jsDelivr) and npm. Likely uses SVG rendering internally, consistent with its hand-drawn stroke aesthetic. The API pattern (passing an SVG element and a config object) resembles Chart.js conventions. Likely wraps a roughness/sketchy rendering layer over standard SVG path generation.
Not documented in README
Last push was June 17, 2026 — approximately 8 days before the evaluation date — indicating active maintenance. Despite slow star growth, the repository is clearly not abandoned. The v2 major version on npm suggests at least one significant iteration cycle has occurred.
ADOPT IF: you need browser-rendered charts with a deliberately informal, hand-drawn aesthetic for blogs, creative projects, educational content, or humorous presentations and want a simple drop-in library. AVOID IF: you need production-grade charting with accessibility requirements, extensive chart types, animation control, or serious business presentation quality. MONITOR IF: you are evaluating it for a project that might need to evolve beyond its current chart type set, as the niche scope may become a constraint.
Independent dimensions
Mainstream potential
2/10
Technical importance
3/10
Adoption evidence
3/10
- Stylistic niche limits adoption ceiling — as novelty of the xkcd aesthetic fades, growth pressure may erode maintenance motivation over time.
- Single maintainer (timqian) with no evident organizational backing creates bus factor risk for long-term sustainability.
- Limited chart type coverage compared to general-purpose libraries may force users to maintain two charting dependencies in larger projects.
- No documented accessibility (ARIA, screen reader) considerations in the README, which may be a blocker for professional or public-sector deployments.
- Slow star growth and modest fork count (207) suggest a limited contributor community, which may slow bug fixes and feature requests.
Likely to remain a stable, slowly maintained niche tool used by indie developers and bloggers. Mainstream adoption is unlikely given its purely stylistic value proposition. Risk of gradual neglect if the maintainer shifts focus, though recent activity suggests continued personal interest.
Explore similar
Newsletter
Get analyses like this every Monday
Free weekly digest of the most interesting open-source discoveries.
Languages
Information
- Website
- https://timqian.com/chart.xkcd/
- Language
- JavaScript
- License
- MIT
- Last updated
- 3w ago
- Created
- 84mo ago
- Analyzed with
- anthropic/claude-haiku-4-5
Stars over time
Contributors over time
Top 100 contributors only — repos with more will plateau at 100.
Open issues
No open issues — clean slate.
Open pull requests
No open pull requests.
Top contributors
Similar repos

chartist-js/chartist
Chartist is a lightweight, SVG-based charting library designed for responsive...
| Repository | Stars | Week Δ | Language | Score | Updated |
|---|---|---|---|---|---|
|
timqian/chart.xkcd
this
|
7.8k | +3 | JavaScript | 7/10 | 3w ago |
|
chartist-js/chartist
|
13.4k | — | TypeScript | 7/10 | 2d ago |
 knowm/XChart knowm/XChart
|
1.6k | — | Java | 7/10 | 1d ago |
 chartjs/Chart.js chartjs/Chart.js
|
67.6k | — | JavaScript | 9/10 | 1mo ago |
 d3/d3 d3/d3
|
113.2k | — | Shell | 9/10 | 1mo ago |
 antvis/X6 antvis/X6
|
6.6k | — | TypeScript | 8/10 | 3w ago |
Chart.js is the dominant general-purpose charting library with 67k+ stars and broad production adoption. chart.xkcd shares similar API conventions but occupies a purely aesthetic niche — they are complementary rather than directly competitive for most use cases.
D3 offers complete control over data visualization at the cost of significant complexity. chart.xkcd provides a far simpler API for its specific aesthetic output, but cannot match D3's flexibility or range. Different audiences entirely.
Frappe Charts targets clean, professional SVG charts with minimal dependencies. Both are simpler alternatives to D3, but frappe charts aims for polished business aesthetics while chart.xkcd deliberately pursues a casual, sketchy look.
Chartist offers lightweight, responsive SVG charts with CSS styling flexibility. It targets professional use cases, making it a direct alternative for serious charting needs but irrelevant as a stylistic competitor to chart.xkcd.
Python's matplotlib has a built-in xkcd() context for the same aesthetic. In Python data science workflows, that is the natural choice. chart.xkcd fills the same niche in the JavaScript/browser environment.