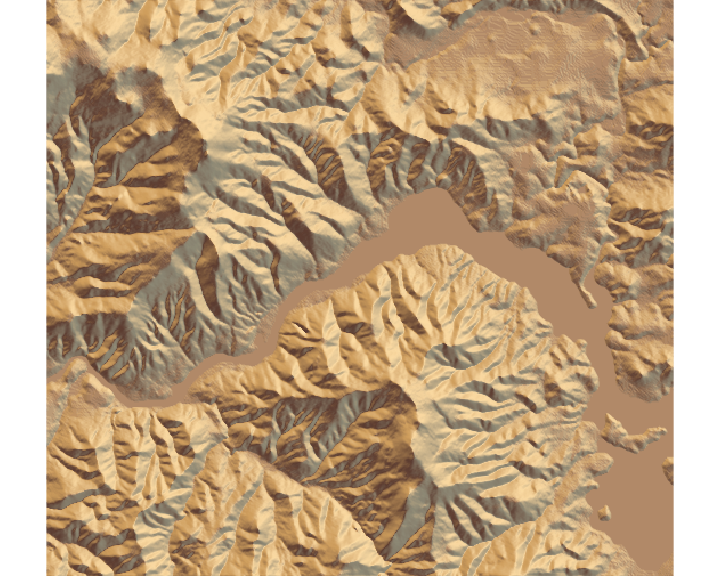
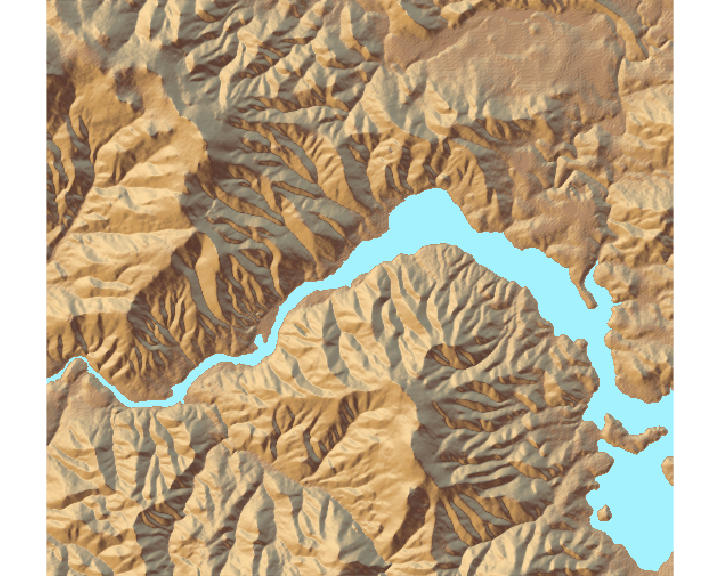
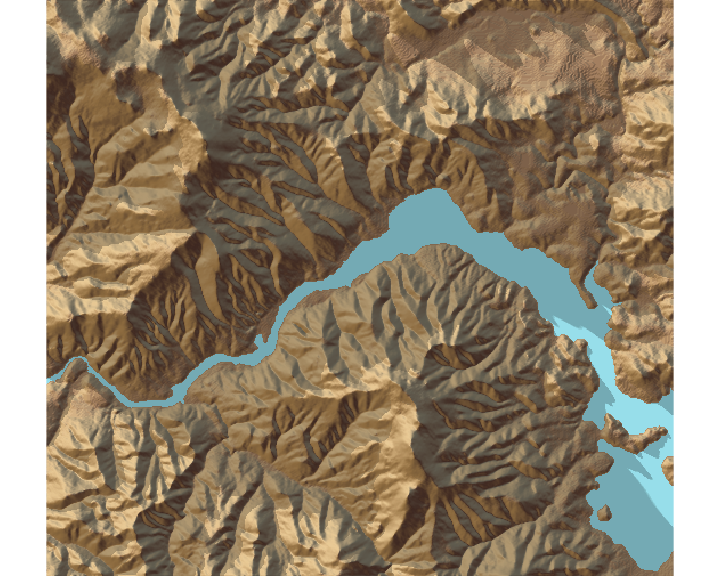
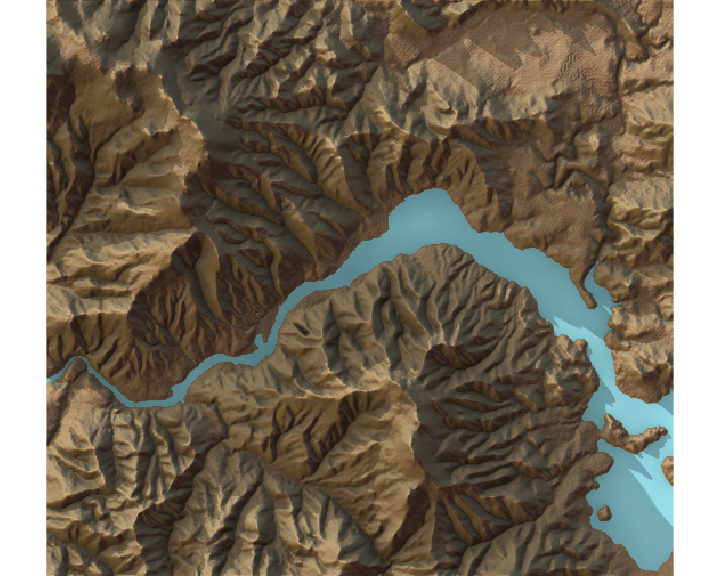
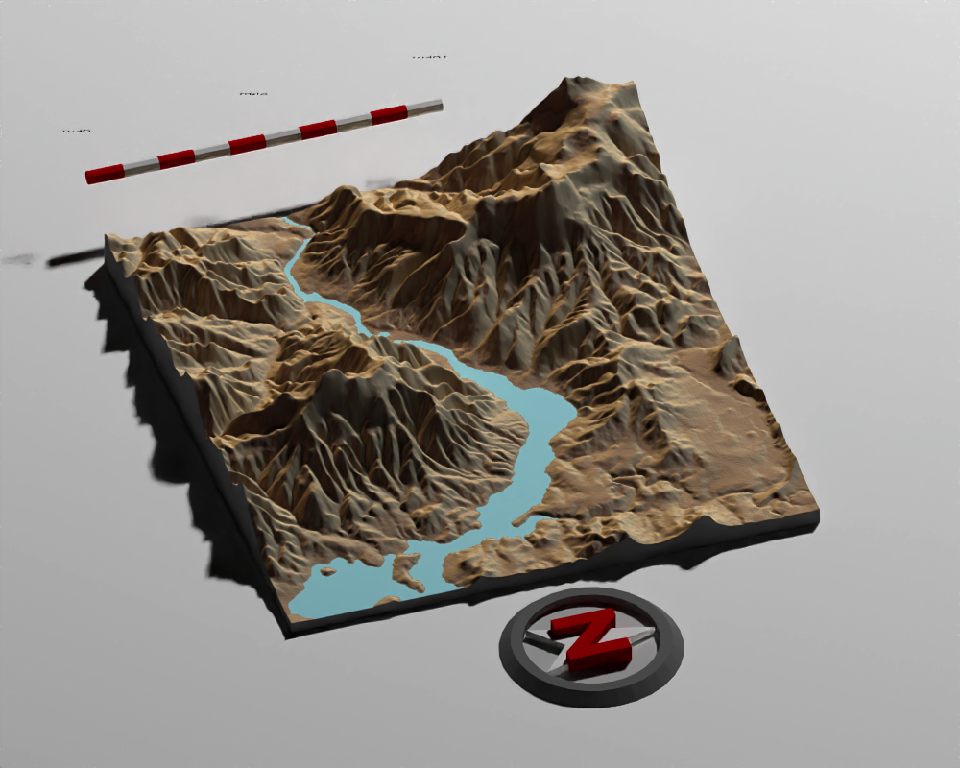
R Package for 2D and 3D mapping and data visualization
2.2k
Stars
219
Forks
48
Open issues
8
Contributors



AI Analysis
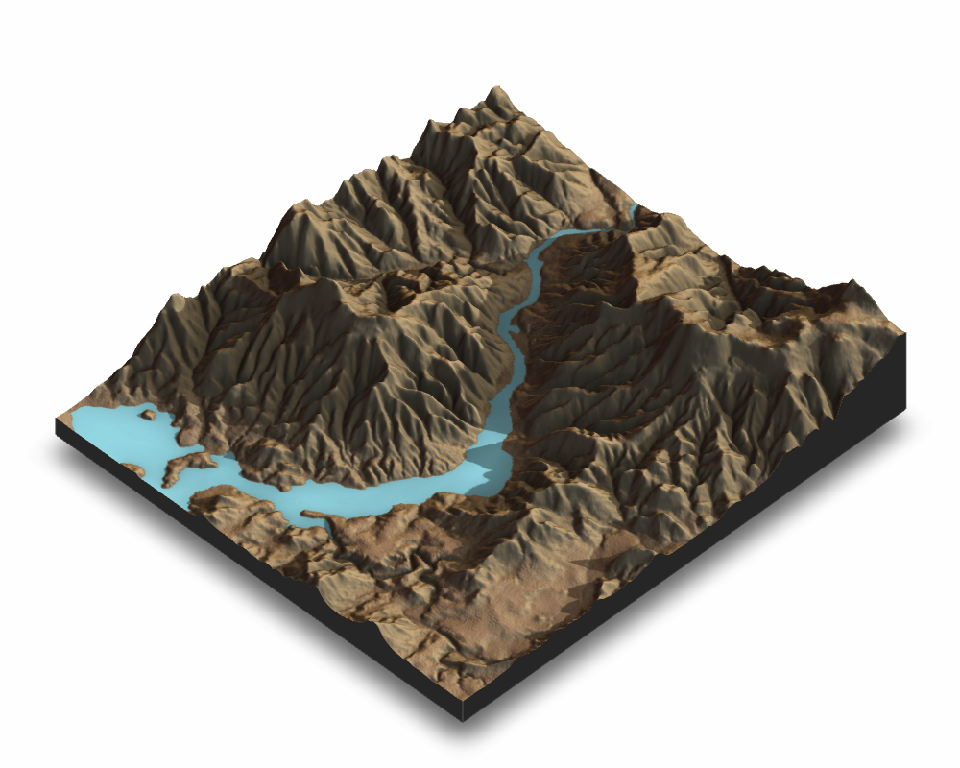
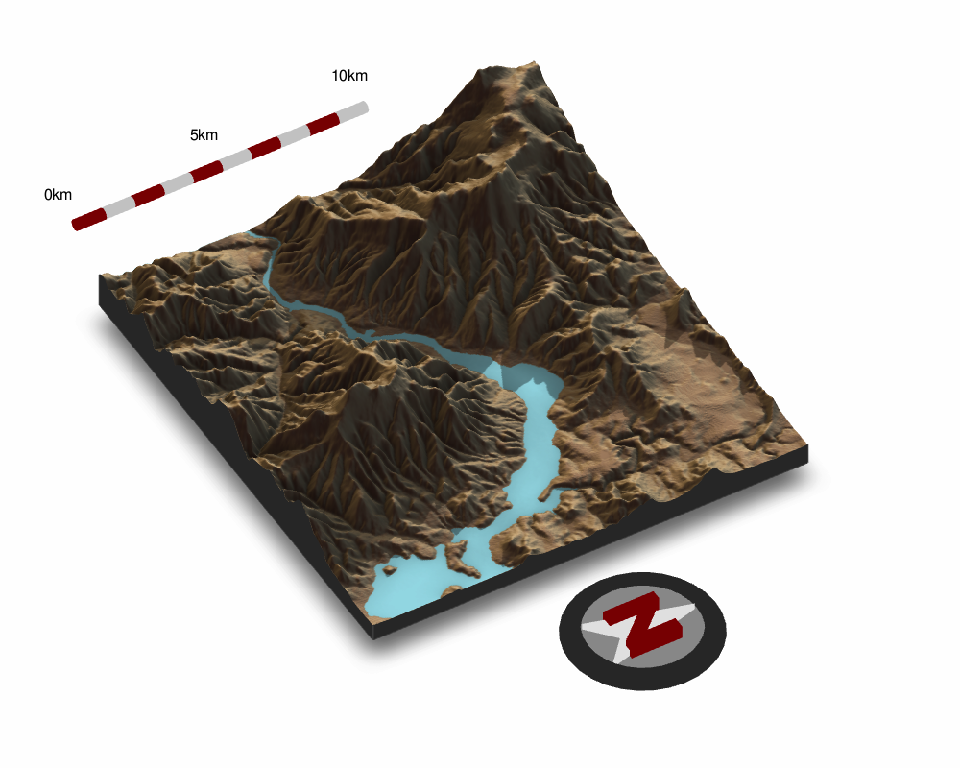
rayshader is an R package for creating 2D and 3D data visualizations and maps using elevation data, raytracing, and hillshading algorithms. It specializes in cartographic visualization and ggplot2-to-3D conversion for researchers, geographers, data scientists, and cartographers who need publication-quality maps and terrain visualizations—not a general-purpose visualization library for non-spatial data.
Inferred from signals mentioned in the README (tests, CI, type safety) — not a review of the actual code.
AI's overall editorial judgment — not an average of the bars above, can weigh other factors too.
R package for 3D mapping and data visualization via raytracing and hillshading algorithms
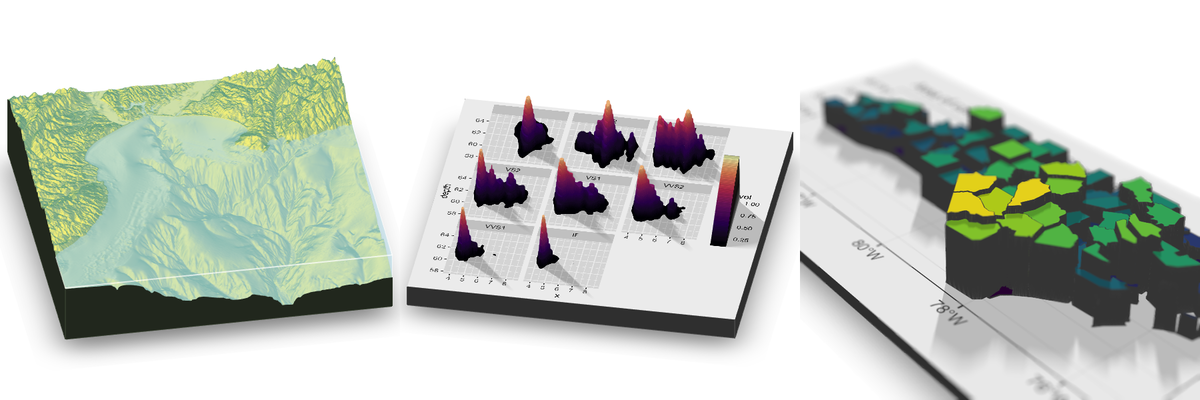
rayshader is an R package that converts elevation matrices and ggplot2 objects into 2D and 3D visualizations using raytracing, hillshading, and ambient occlusion techniques. Built for cartographers, data scientists, and researchers who need publication-quality terrain and 3D data maps. Used primarily within the R ecosystem for specialized geospatial and scientific visualization; adoption appears concentrated among academic and professional mapping communities rather than mainstream adoption.
Created May 2018 by Tyler Morgan-Wall. Evolved from a hillshading and raytracing tool into a comprehensive 3D visualization package. Positioned as a bridge between R's data manipulation capabilities and publication-quality 3D rendering, filling a gap where existing R mapping tools offered limited 3D interactivity.
Repository shows steady maintenance with 2,169 stars accumulated over 8 years, but 0 stars gained in the last 7 days suggests stable rather than growing adoption. Last commit on 2026-07-10 indicates active ongoing maintenance. Growth appears driven by niche awareness within R geospatial community rather than viral adoption or category expansion.
adoption not verified. README includes gallery images and function examples but does not document specific organizations, publications, or case studies using rayshader. No evidence in provided metadata of production deployment scale or user base size. Presence on CRAN and active GitHub presence suggests some professional use, but magnitude unclear.
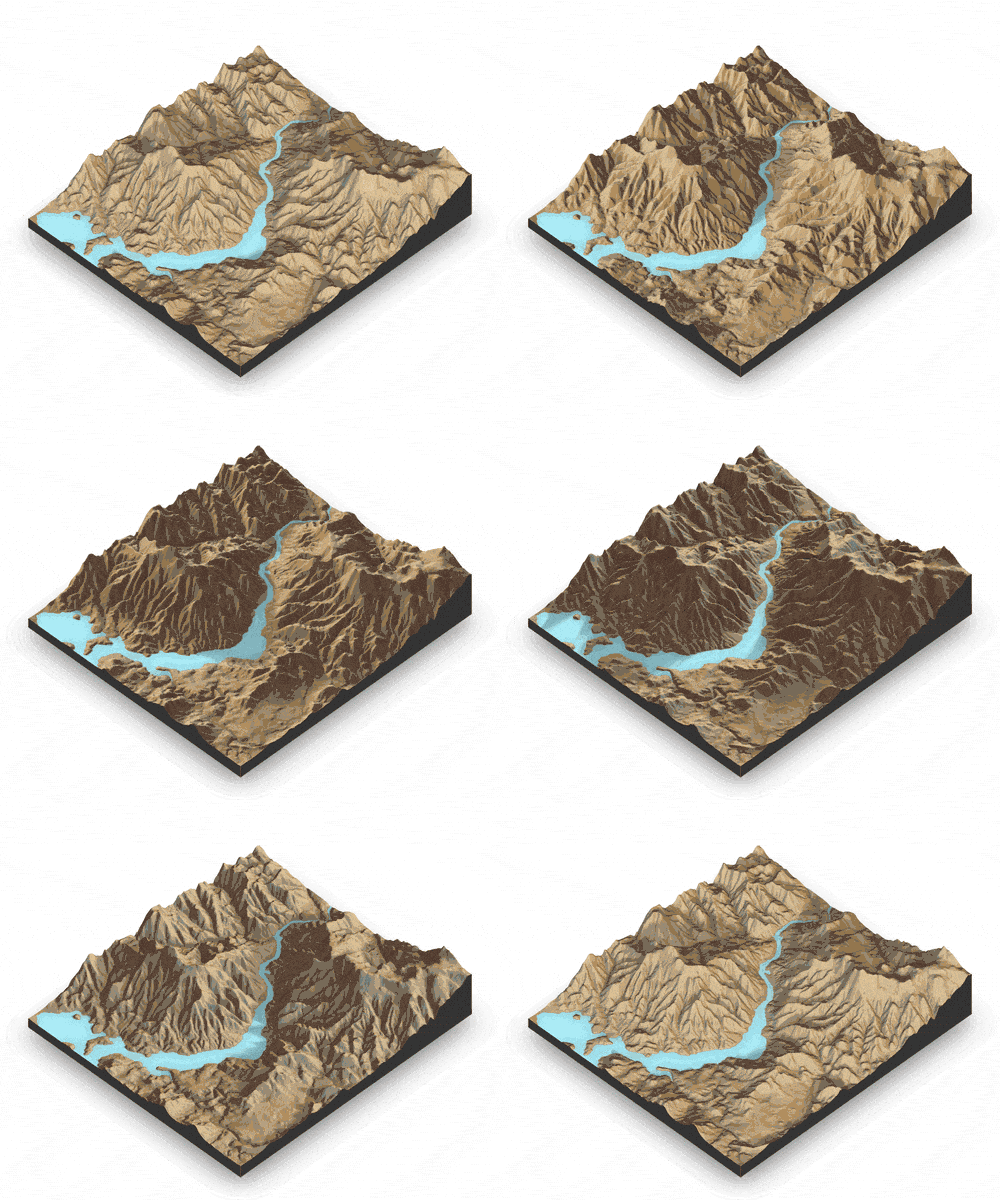
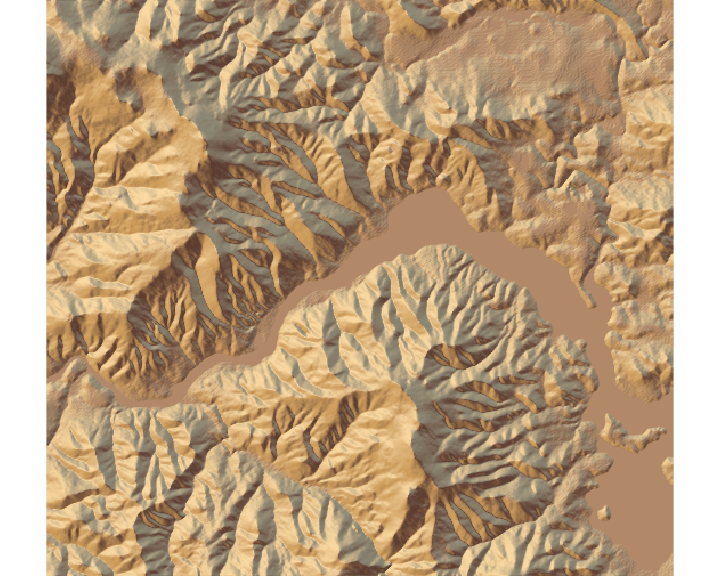
Based on README, rayshader appears to operate as a composition layer: accepts R matrices and ggplot2 objects, applies multiple shading algorithms (ray_shade, sphere_shade, ambient_shade, texture_shade, lamb_shade) and overlays them sequentially. Likely uses rasterization and matrix operations for 2D shading, then 3D rendering via rayrender package or built-in pathtracer. Architecture suggests functional programming style typical of R packages.
not documented in README
Repository was last pushed 2026-07-10 (current date), indicating active maintenance. However, lack of recent star activity and modest fork count (219) suggests the maintainer is actively supporting existing users rather than driving rapid growth. Longevity of 8 years with continuous maintenance indicates stable, mature project rather than abandoned or stagnant.
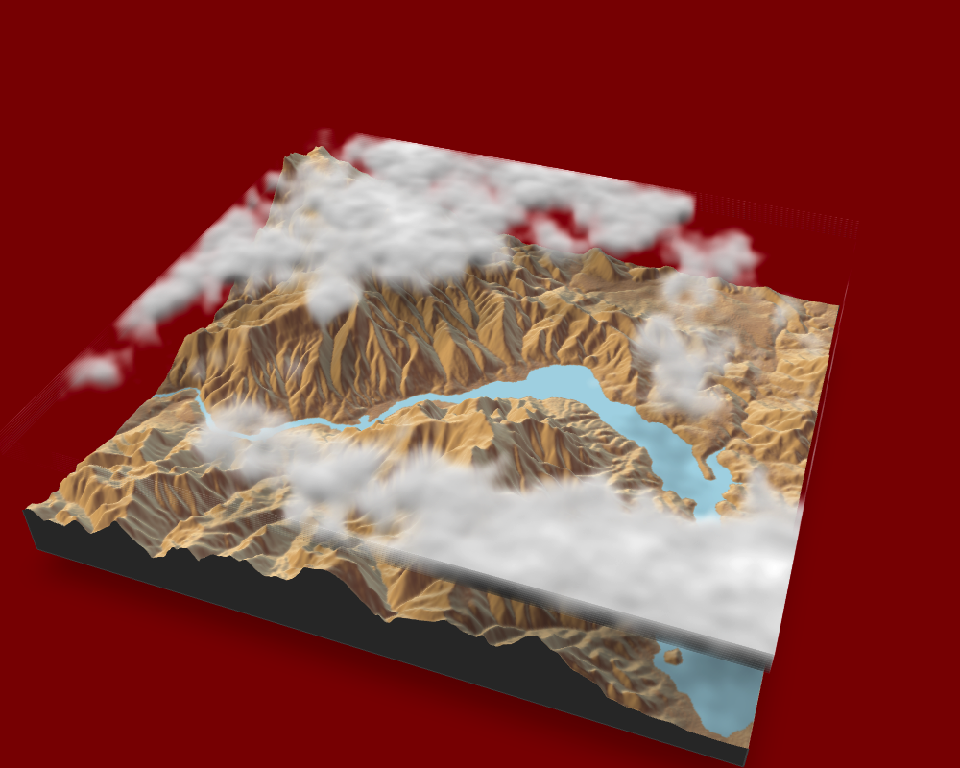
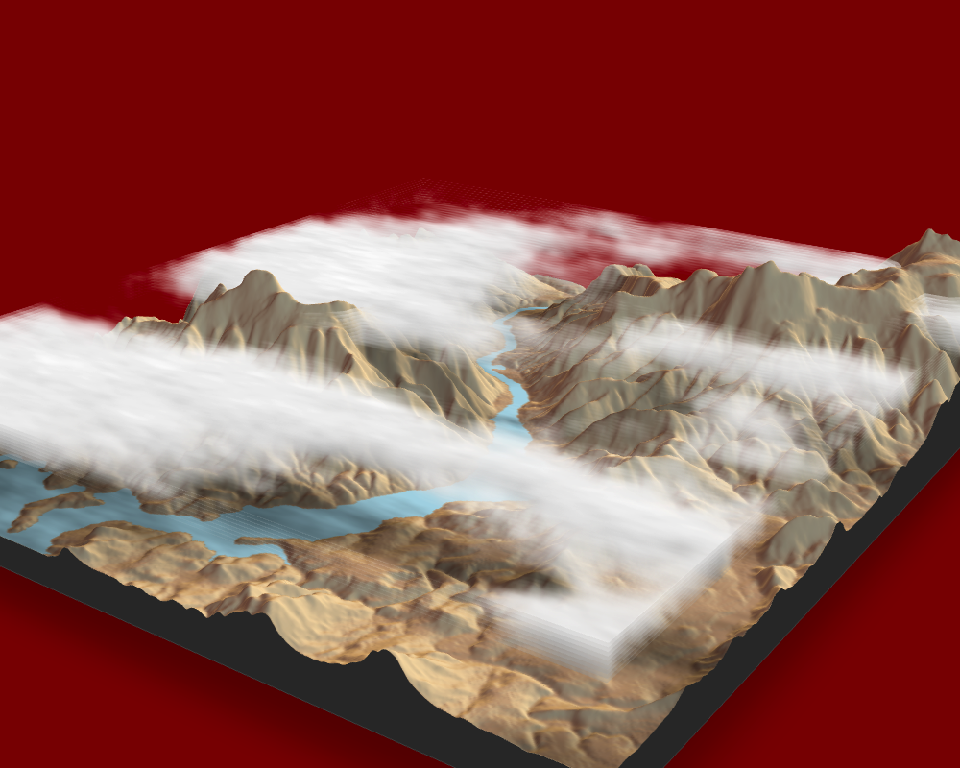
ADOPT IF: you work in R, need 3D terrain or elevation visualization, and want reproducible, scriptable maps with cinematic effects (pathtracing, depth of field). Use if publishing scientific maps or building interactive 3D overlays on geospatial data. AVOID IF: you require web-native 3D maps, need real-time performance for massive datasets, or work primarily outside R. Avoid if you need GUI-based workflows without coding. MONITOR IF: you are considering rayshader as part of a multi-language pipeline — verify R integration fits your workflow; also monitor if you need advanced 3D editing capabilities beyond rayshader's export formats (STL, OBJ).
Independent dimensions
Mainstream potential
3/10
Technical importance
6/10
Adoption evidence
4/10
- Adoption concentrated in R ecosystem; limited cross-language interoperability means projects heavily dependent on R may face maintenance risk if R usage declines in organization.
- Performance scaling unknown for very large elevation matrices or high-resolution rendering; README does not document computational limits or benchmarks.
- Single maintainer (apparent from repository structure) creates bus factor risk; no evidence of large contributor base.
- 3D export formats (STL, OBJ) are basic; comparison with specialized 3D modeling tools (Blender, CAD software) suggests rayshader may not meet production 3D printing or professional CAD workflows.
- Dependency on rayrender package for high-quality rendering creates coupling; updates or changes to rayrender could break rayshader workflows.
rayshader will remain a stable, niche tool for R-based scientific visualization and geospatial work. Unlikely to expand beyond R community or become a mainstream 3D mapping platform. May see incremental feature additions and dependency updates but is unlikely to drive major new paradigms in 3D visualization. Serves its specialized purpose well but not positioned for broad adoption outside R.
Newsletter
Get analyses like this every Monday
Free weekly digest of the most interesting open-source discoveries.
Languages
Information
- Website
- https://www.rayshader.com/
- Language
- R
- Last updated
- 8h ago
- Created
- 99mo ago
- Analyzed with
- anthropic/claude-haiku-4-5
Stars over time
Contributors over time
Top 100 contributors only — repos with more will plateau at 100.
Open issues
Add_overlay
Remove redundant abs() call
Performance Optimisation: Remove unused/redundant heightmap modification in sphere_shade()
Include faces in save to .obj function [FEATURE]
Options for rendering large, high-resolution rasters
Top contributors
Recent releases
No releases published yet.
Similar repos

holoviz/datashader
Datashader is a data rasterization pipeline for rendering large datasets into...
| Repository | Stars | Week Δ | Language | Score | Updated |
|---|---|---|---|---|---|
|
tylermorganwall/rayshader
this
|
2.2k | — | R | 8/10 | 8h ago |
 ricktu288/ray-optics ricktu288/ray-optics
|
1.7k | — | JavaScript | 8/10 | 6d ago |
 ray-project/ray ray-project/ray
|
43.2k | — | Python | 9/10 | 3h ago |
|
holoviz/datashader
|
3.6k | — | Python | 8/10 | 3w ago |
 NASA-AMMOS/3DTilesRendererJS NASA-AMMOS/3DTilesRendererJS
|
2.4k | — | JavaScript | 8/10 | 1d ago |
ggplot2 handles static 2D visualization; plotly adds interactivity. rayshader specializes in 3D terrain and elevation rendering with cinematic effects (depth of field, pathtracing) — different niche, not direct replacement.
leaflet focuses on interactive web maps (Slippy maps); rayshader focuses on 3D scientific visualization and terrain rendering. Serve different use cases (web mapping vs. cinematic 3D publication).
rgl is a general-purpose 3D graphics engine for R; rayshader is purpose-built for elevation and terrain visualization with specialized shading algorithms. rayshader likely easier for mapping, rgl more flexible for general 3D.
Desktop GIS tools with 3D plugins; rayshader programmatic approach allows reproducible, scriptable workflows. Trade-off: GUI accessibility vs. automation.
GDAL is low-level geospatial I/O; rayshader is high-level rendering. rayshader sits at different abstraction layer focused on aesthetics and interactivity.